Track your performance with report cards
Daily, weekly, and monthly self-reviews that score your process, audit your risk rules, and set goals for the next session.
What is a trading report card?
A trading report card is a periodic self-review where you score your trading process and results over a day, week, or month.
It captures what worked, what broke, and what to fix before the next session. Not a vanity P&L screenshot. A structured accountability check.
The workspace
Pick a period, review everything
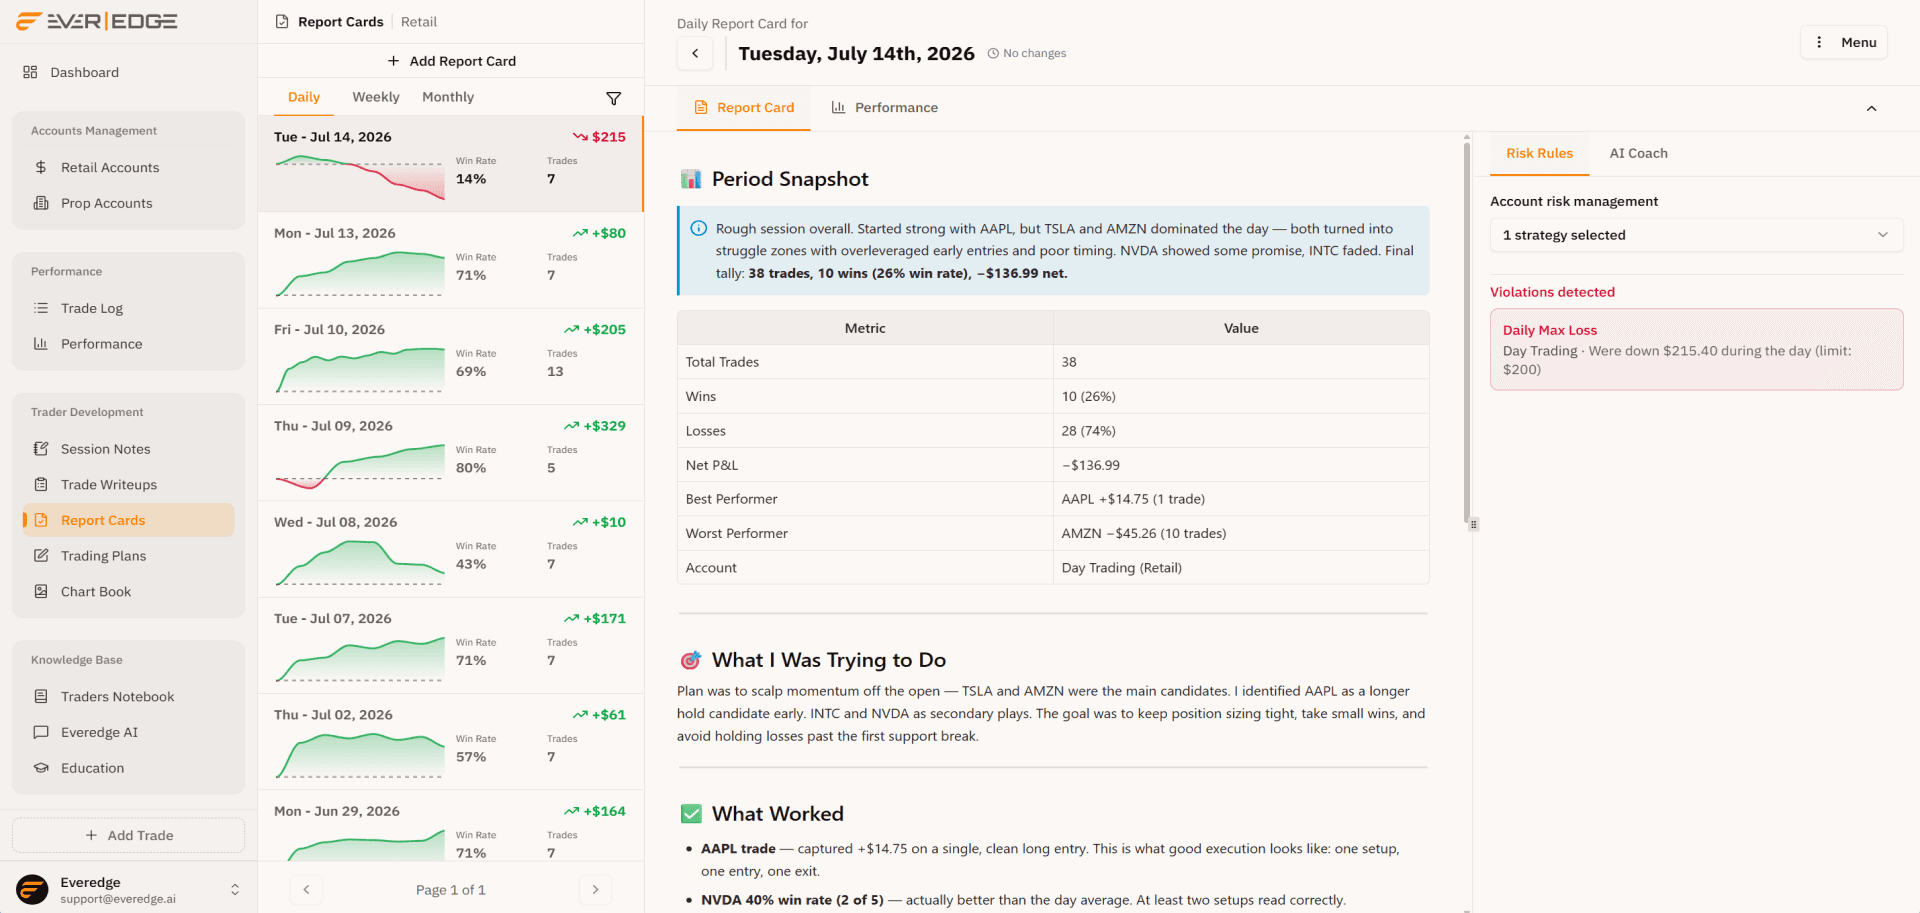
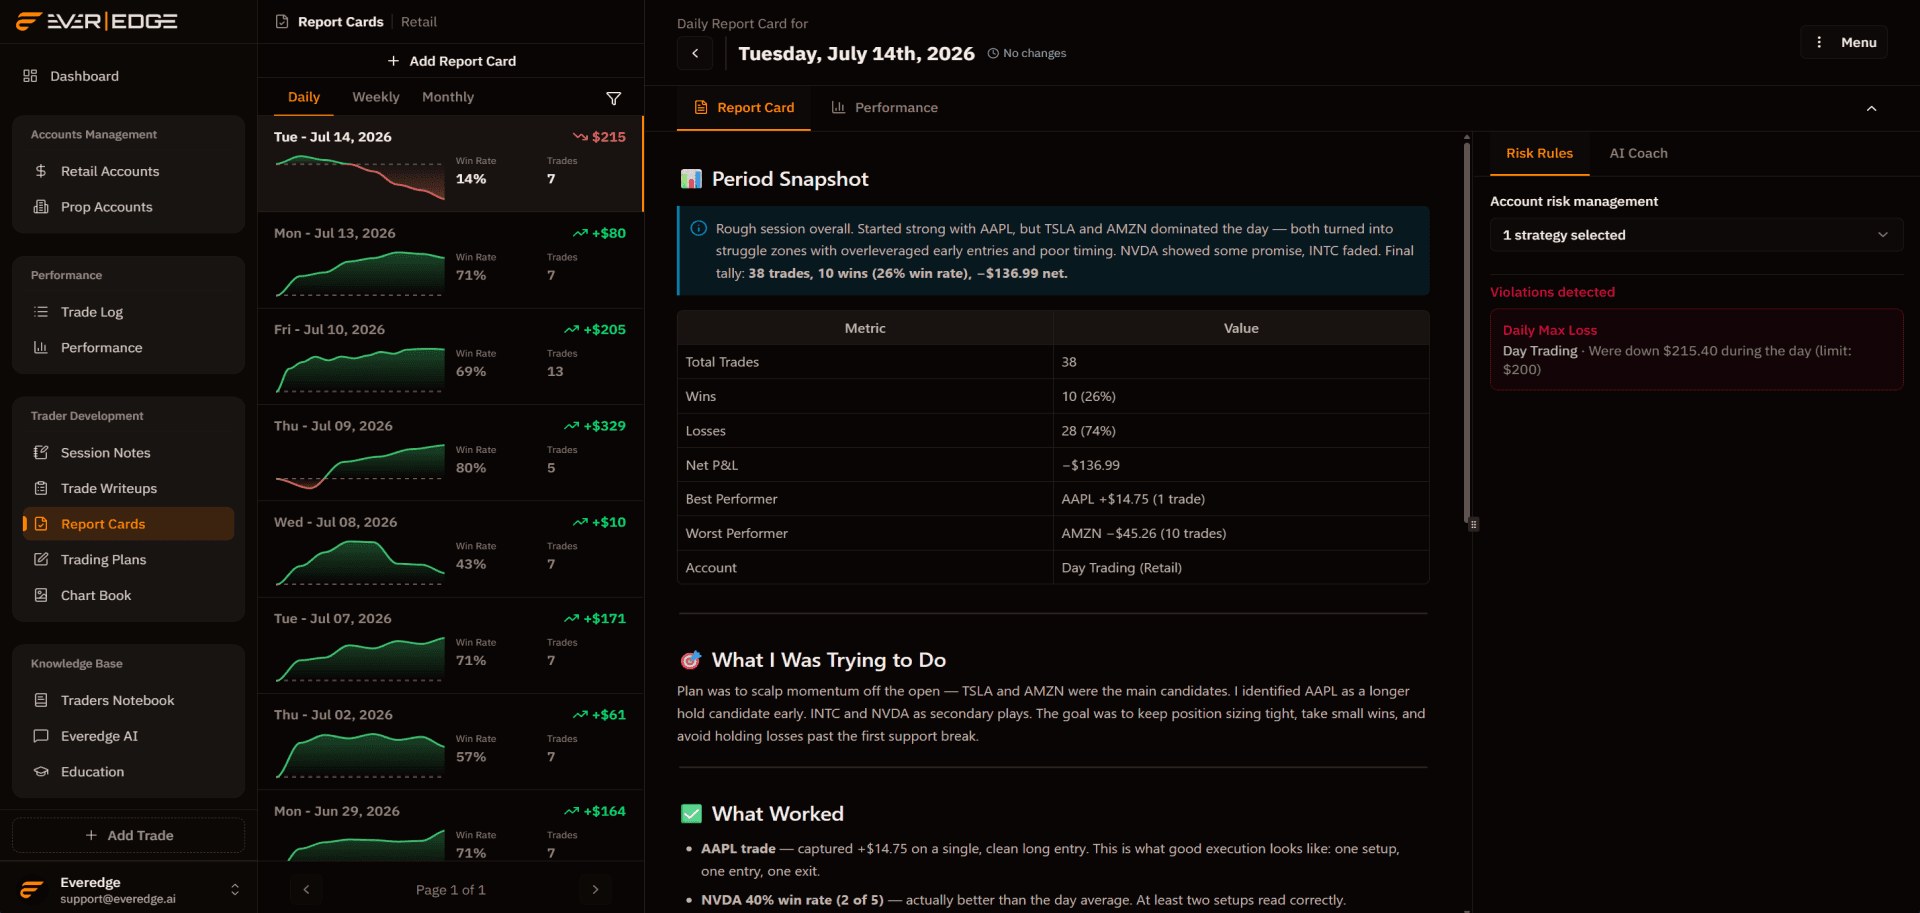
Daily, weekly, and monthly cards sit in one list. Open a period to load performance stats, risk rule violations, and AI coaching without leaving the review.
Tue - Jul 14, 2026
$215Win Rate
14%
Trades
7
Mon - Jul 13, 2026
+$80Win Rate
71%
Trades
7
Fri - Jul 10, 2026
+$205Win Rate
69%
Trades
13
Thu - Jul 09, 2026
+$329Win Rate
80%
Trades
5
Daily, weekly, monthly
Switch cadence and scroll past cards with sparklines, win rate, and trade count. The active card highlights on the right edge.
Account risk management
Violations detected
Daily Max Loss
Day Trading · Were down $215.40 during the day (limit: $200)
Risk rules audit
Account risk rules run against every card. Violations surface in red with the limit, actual drawdown, and which strategy triggered the check.
How can I help?
Ask about risk violations, period performance, or what to fix before the next session.
Message your AI coach...
AI Coach
Ask which days broke your rules, what patterns show up in losing weeks, or what to fix before the next session. Scoped to the active report card.
Numbers tell you what happened. Report cards tell you why.
Performance tab
Quick detailed stats on every reporting period
Each daily, weekly, or monthly card carries its own stat grid, win/loss breakdown, symbol P&L, and trade log. Period-scoped snapshots, not the full performance analytics dashboard.
Total Gain/Loss
-$215.40
Avg Daily Gain/Loss
-$215.40
Avg Trade Gain/Loss
-$30.77
Total Trades
7
Avg Hold (Scratch)
0s
Scratch Trades
0
P&L Std Dev
$39.66
K-Ratio
-13.17
Largest Gain
+$47.40
Volume
210
Avg Winning Trade
$47.40
Winning Trades
1 (14.3%)
Avg Hold (Wins)
30s
Max Consecutive Wins
1
Random Chance
99.22%
Profit Factor
0.18
Largest Loss
-$80.40
Avg Per-Share G/L
-$1.03
Avg Losing Trade
$43.80
Losing Trades
6 (85.7%)
Avg Hold (Losses)
7m 30s
Max Consecutive Losses
6
Kelly %
-64.92%
Total Commissions
$10.50
Period stat grid
Gain/loss, volume, hold times, streaks, and advanced metrics like profit factor and Kelly percentage for the selected card only.
Win/Loss Ratio
P&L by Symbol
AMAT
+$52
NVDA
+$62
TSLA
+$70
AMZN
-$18
Win/loss and symbol P&L
Win rate donut and a P&L-by-symbol bar chart show where that reporting period went green or red without opening the full trade log.
 AMAT
AMAT NVDA
NVDA TSLA
TSLA AMZNAMATNVDATSLAAMZNAMAT
Period trade log
Every trade in the card with side, net P&L, win/loss status, and tagged playbook. Expand a row for entry, exit, and commission detail.
Not the full analytics dashboard. The stats that belong to that period.
The writing surface
Write the review
Goals, callouts, and improvement notes in the same Notion-style editor used across Everedge. Tables, performance embeds, and links to trading plans and write-ups.
The same premium editor behind your plans and write-ups, tuned for periodic self-review.
Select to format, or hand it to AI
Tighten your review, fix grammar, or expand a section without leaving the report card.
The gap and go works best when volume confirms the break above premarket highs.
Every report card connects
Link trading plans, write-ups, and playbooks. Your goals stay tied to the process behind the numbers.
🎓 Report Card
8 linked docs
Embed any document
Slash-insert a live link to a trading plan, write-up, or strategy right inside your report card.
Connect AI to your report cards
Use MCP to draft and update report cards from Claude or Cursor, without leaving your workflow.


A review you actually want to reference later.
Start reviewing with report cards
Build the accountability habit that turns green days into proof, not hope.