Deep stats and your equity curve
Equity curve, win rate, profit factor, and breakdowns by day, hour, playbook, and strategy. The stats that matter, framed honestly.
What is trading performance analytics?
Trading performance analytics is the statistical analysis of your trading results over time, including equity curves, win rates, and breakdowns by setup and execution.
Raw P&L is noise. Win rate times payoff ratio is signal. Analytics show where the edge lives without flattering a lucky month.
Overview
Summary stats and cumulative P&L
Headline metrics, the cumulative equity curve, and the breakdown charts you use every session. Same views as the Overview tab in the app.
Key metrics
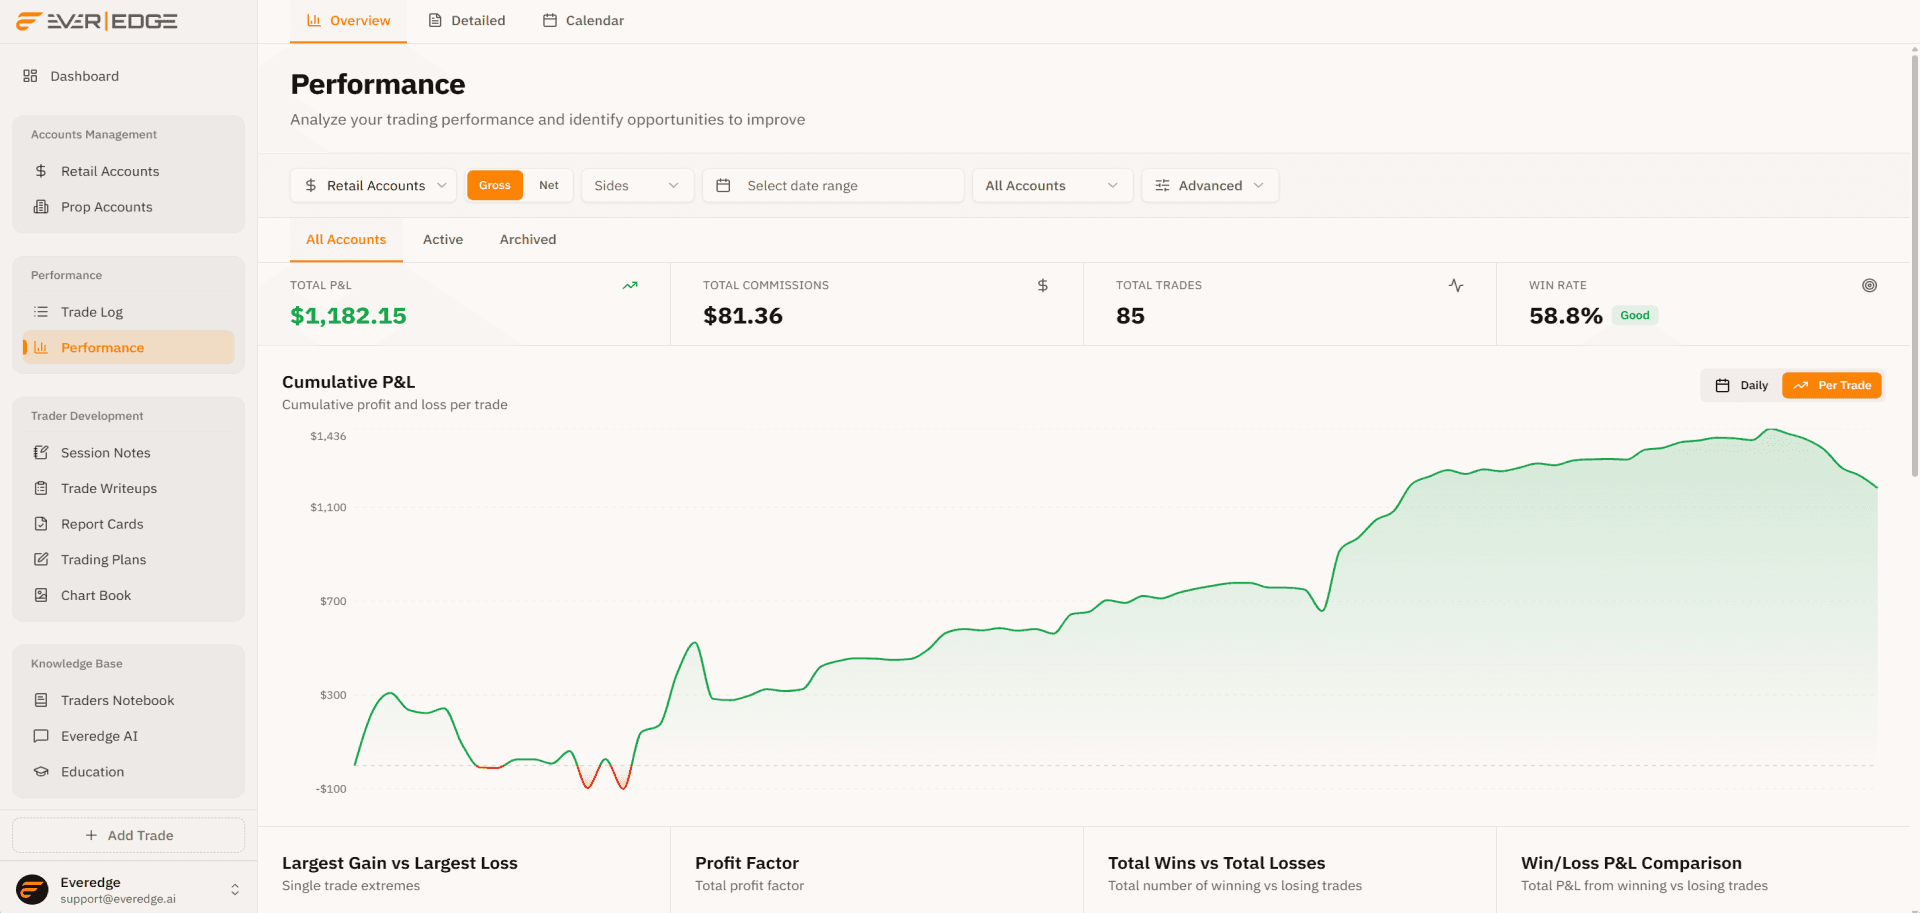
Total P&L, commissions, trade count, and win rate roll through on compact stacked cards, like a rotary stat drum.
Total P&L
$1,182.15
Total Commissions
$81.36
Total Trades
85
Win Rate
58.8%
GoodCumulative P&L
Cumulative profit and loss per trade
Cumulative P&L
Per-trade or daily cumulative curve with the same green-above-zero and red-below-zero styling as your live dashboard.
Profit Factor
Total profit factor
Profit Factor
1.86
Breakdown charts
Donut and bar charts for profit factor, win/loss splits, and ticker rankings. Rotates through representative views from the app.
Headline P&L is a sample. The curve and breakdowns tell the story.
Detailed
Deep stats and time-of-day edge
Extended metrics, hour-by-hour P&L, and drawdown stats from the Detailed tab. A representative slice, not every field.
Performance by Hour of Day
Average P&L per hour
Performance by hour
See when your edge shows up. Green and red bars map average P&L and share of total by hour.
Detailed metrics
Extended stats from the Detailed tab on the same rotary drum as key metrics. Each card rolls through at the same size.
Total Gain/Loss
$1,182.15
Largest Gain
$260.10
Largest Loss
-$240.00
Average Daily Gain/Loss
$107.47
Average Trade Gain/Loss
$13.91
Total Number of Trades
85
Number of Winning Trades
50
Profit Factor
1.86
Average Winning Trade
$51.21
Average Losing Trade
-$39.38
Max Consecutive Wins
7
SQN
1.70
Drawdown Stats
Per-trade drawdown metrics
Average Drawdown
$127.00
Average Trades in Drawdown
3.9
Biggest Drawdown
$408.41
Trades in Biggest Drawdown
15
Drawdown stats
Average and max drawdown depth plus how many trades you spent underwater on the way there.
Performance by Day of Week
Average P&L per day
Performance by weekday
Average P&L for Mon through Fri. See which sessions carry the month and which drag.
Trade Distribution by Month
Number of trades per month
Trade distribution
Trade count by month for the selected year. Spot activity clusters and quiet stretches.
Performance By Price
P&L by price range
Performance by price
P&L grouped by entry price range. Find where your setups actually pay across tick sizes.
This only scratches the surface. There is so much more in the app.
Calendar
Daily P&L at a glance
The Calendar tab tints each day by result, rolls up the month on the right, and opens a day panel when you click a date.
July 2026
$175
7 trades
$122
5 trades
-$205
4 trades
$92
$152
6 trades
$260
9 trades
$92
4 trades
$128
5 trades
$218.96
13 trades
$850.96
$142
6 trades
$185
7 trades
-$92
3 trades
$98
4 trades
$115
5 trades
$448
$165
6 trades
$88
3 trades
$195
8 trades
-$45
2 trades
$175
7 trades
$578
$92
4 trades
$108
5 trades
$145
6 trades
-$68
3 trades
$132
5 trades
$409
Monthly calendar
Green and red cells show daily P&L and trade count. Weekly totals stack in the right column.
July 2026
$688.08
Month at a glance
Headline month P&L, cumulative curve, and the stats list you see before drilling into a day.
Friday, July 10, 2026
$218.96
Day detail
Click any trading day to open intraday performance, commissions, and largest win for that session.
Sample July 2026 data. Your calendar reflects your actual sessions.
Analyze your performance
See where the edge lives with stats built for serious traders.